Is there any way to disassemble the bios file?
-
Those limits you found in the docs are built into the CPU by Intel but they only determine when turbo boost is available. If you reach the Turbo TDP limit of your CPU then you won't get any more turbo boost until the load goes below that TDP limit. That should leave you at the default 12.0 multiplier. If it is dropping down to 7.0 then that is a bios with a different agenda. Asus should be asked for an explanation of this.
MSR 0x199 is the register that contains the multiplier that you are requesting the CPU to use but that is not necessarily the multiplier that you will end up with. For a Core i7-720, a value of 12 or less should result in that multiplier at full load. A value of 13 should get you the default of 12 plus however much turbo boost the CPU thinks you deserve based on power consumption, temperature and how many cores are in the active state.
What Linux does to this register might be quite different than what Windows does. I intend to look into Windows power profiles as a possible method to get some more control over this.
I might try increasing the frequency that ThrottleStop changes this MSR but with the Asus method, that might not help as you've found in Linux. When someone sends me a log file with the More Data option selected when gaming, I'll see what I can do differently which might improve things.
If this throttling only happens when running Furmark + Prime then trying to fix it might not be practical. When gaming, you never load the CPU or GPU anything like those two do.
Probably but that's beyond me. -
OK, thank you again. That clears it up.

Not as of yet, we need a new tool deal with the newer BIOS format, and none have leaked. I've searched for weeks and found nothing, only some russians claiming to have a newer version which I cannot find. Apparently it could be a hybrid BIOS/EFI format, and we need new versions of amibcp and/or mmtool to work with it.
Reference: http://forum.notebookreview.com/showpost.php?p=5436618&postcount=6 -
i've been fairly busy with school, but here's a new set of data for benching 196.34. verdict: 195.55 is still the king.
run1 [10473] very short stuttering in SM2 test 2. full brightness, iphone charging, full kbd, razer mouse, stock asus clocks:
![[IMG]](images/storyImages/19634-stock15.png)
run2 [10556] no stuttering. 1 brightness:
![[IMG]](images/storyImages/19634-stock1.png)
run3 [11200] visible slowdowns in SM2 test 2. 1 brightness, 550/1375/950 clocks:
![[IMG]](images/storyImages/19634-regoc1.png)
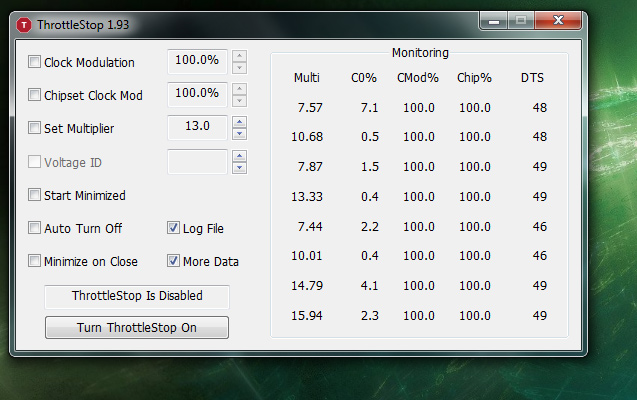
run4 [9263] no visible slowdowns. not exactly sure what was happening in this one, everything was just slower by a lot. full brightness, 550/1375/950 clocks. throttlestop settings: clock modulation @ 100, chipset modulation @ 100, set multi @ 13.
![[IMG]](images/storyImages/19634-regoc15-tscm.png)
run5 [10345] visible slowdowns in the usual parts. slowdowns correspond with a drop in multiplier (as reported by throttlestop) and GPU usage cut in half. full brightness, 550/1375/950 clocks. throttlestop settings: clock modulation @ 100, set multi @ 13.
![[IMG]](images/storyImages/19634-regoc15-ts.png)
turning on 'set multiplier' in throttlestop makes the reported multiplier go berserk, eg. no synchronization on any core and all jumping between 8 and 12.
gl and hth. excellent program btw.Attached Files:
-
-
thalanix: Your log files show some problems. During run 4, ThrottleStop is showing that you are getting no turbo boost so your multiplier is stuck at the default of 12. That's not right. With that amount of load, a Core i7-720 is supposed to be using turbo boost so your average multiplier should be almost 50% higher.
Run 5 is showing what the multiplier should be doing with lots of readings between 17 and 19. That's normal. The multiplier at any instant in time depends on how many cores are in the active state. This is constantly changing hundreds of times a second based on load. As more cores wake up to process background activity, the amount of turbo boost decreases and when they go back to sleep, turbo boost can increase again.
That part is good and the multiplier jumping up and down all over the place on each thread is normal.
The problem is the multiplier being throttled back to 7.0. Your CPU is running at 931 MHz when it should be running at close to (18.0 X 133 MHz) or 2394 MHz. That's a nice kick in the balls.
The throttling scheme on this laptop looks more aggressive than what Dell is using on their XPS 1645. I'm not sure if ThrottleStop can be improved to deal with this better.
You might want to try another benchmark with a full battery so it's not being recharged, the brightness as low as it can go and without charging your i-phone, etc. If you can keep power consumption to a minimum there might be more watts left over to power your CPU and GPU at full speed. -
the throttling only occurs extensively in SM2 tests with regular 260m clocks +full brightness/additional load. SM3 tests are mostly unaffected until reaching 570-580 on the core. this looks like a total asus set, so there's not much of a chance they'll change/remove it. the cooling probably can't handle prime+furmark on most machines.
-
Your run 4 shows continuous CPU throttling for the entire 8 minute test. Your CPU is running at about two thirds of the performance level that Intel has designed into these CPUs.
The DTS column is a direct reading from the on chip digital thermal sensor and that shows me that you are still 29 degrees or more away from the thermal throttling point that Intel has set. Your CPU is not running too hot so it should not be throttling like this.
It's one thing for a computer not to be able to handle Prime + Furmark but your computer is fully loading only 1 of its 4 cores yet is throttling like crazy. That's a problem that Asus needs to fix.
Your second log file was worse with throttling episodes down to 7.0. CPU throttling like this is going to kill gaming performance and result in intermittent stuttering. You're not being allowed to use the full performance of the laptop that you paid for. Maybe ask Asus to refund you half your money since you're not being allowed to use your CPU at its full rated speed.
For comparison, the new Dell 1647 with a Core i7-620 Dual Core was able to use its full default 20 multiplier while running the Prime95 + Furmark test. Why sell a Quad core if it's going to throttle when loaded? -
run4 was with chipset modulation. idk what it does, so i gave that a go.
unfortunately it takes quite a bit of load to get to the power threshold for throttling, even running overclocked, so i doubt asus will offer even a partial refund. someone stated in the BSOD thread that they asked xotic about it (who forwarded to asus), and i think ken is also aware.
given that it took 3 months for them to fix the BSoD issue, which still isn't on the official site, i don't expect them to change a limit they set in this notebook's lifetime. -
bump for awareness
some comments on bennyg's runs;
exactly the effect, and usually the only test that exhibits the throttling.
demanding scene. gpu-z utilization should be still showing 95-100%.
looks like you found the threshold at that setup, and the fan turning up to max (however little more power it needs) puts it over.
+rep -
So let me see if i am tracking with you guys.
1. It is not a psu issue.
2.It maybe a bios issue. Due to how the bios tells the computer to move power?
3.It could be a motherboard issue. As in it can not physically handle the load of all the hardware.
I am i understanding you guys?
Also you guys never replied to my comment on the other thread. We know its not a psu issue so where does the power go to after the psu? Like does it go straight to the mouther board? or does it go somewhere else first? I know with a desktop it goes from the psu to the different rails. Then from there to each part of the PC. So how does it work in a laptop? Does it go straight to the mother board and the mother board distributes the power to everything? The reason why i am asking is because with a desktop you can overload a single rail so if you dont balance a rail's load between them all you can blow the psu or motherboard or just have a lose of power. If its like a computer can it be a problem that power is asking to much from a single source? I am be completely wrong but i thought i would mention this again. Its always a good idea to start from one source and work your way down the line to find the problem. -
we don't know without schematics. it would make sense it worked similar to a desktop, but just about everything is 5v (minus cpu/gpu). the most likely cause is either the distribution or bios, and given the cycling it's most likely a bios-set limit.
-
ok i see what you mean. I would have to agree with u on the bios thing. Just as you stated its in a pattern that is consistent.
-
The throttling problem in my case exists only in Star Wars - The Force Unleashed, maxed out, with physX on. Have anyone tried this game on G51j? Every couple of seconds the game slows down very much (to about 5fps) and goes back to normal.
-
have you tried lowering the screen/keyboard? if the drop is throttling-related (checked with realtemp/gpu-z logs that CPU goes down to 7x in accordance with a drop in GPU usage), then reducing those should either reduce the cycling frequency or help it altogether.
i don't have SW:FU to check, but any CPU- and GPU-heavy game will cause this as it's approaching the furmark/prime95 testing conditions. -
The strange thing is that it happens only in this game. I checked today this game on a desktop (Q9300 2.5Ghz + 9800GTX) and it works perfectly. How can I check if during the gameplay my clocks are downclocking and the slowdowns are related with that?
Edit: I'll try to use the programs You mentioned. BTW is there a chance that the throttling problem can be resolved (as BSOD was fixed)? I don't know the technical background of this process and if it can be solved with some BIOS fix or something software-related... -
realtemp + gpu-z both have a log-to-file feature. find a good place in-game to run laps around something, and make note of when you start and stop apx. exit and open up the logs.
eg. from my logs @ http://forum.notebookreview.com/showthread.php?p=5798357#post5798357, kinda hard to see since this had more frequent cycling but good enough as an example.
gpuz
realtempCode:2010-01-28 21:25:00 , 550.0 , 950.0 , 1375.0 , 79.0 , 240 , 99 , 36 , 0 , 2010-01-28 21:25:01 , 550.0 , 950.0 , 1375.0 , 80.0 , 240 , 99 , 36 , 0 , 2010-01-28 21:25:02 , 550.0 , 950.0 , 1375.0 , 80.0 , 240 , 99 , 36 , 0 , 2010-01-28 21:25:03 , 550.0 , 950.0 , 1375.0 , 80.0 , 240 , 99 , 36 , 0 , 2010-01-28 21:25:04 , 550.0 , 950.0 , 1375.0 , 81.0 , 240 , 99 , 36 , 0 , 2010-01-28 21:25:05 , 550.0 , 950.0 , 1375.0 , 81.0 , 240 , 99 , 36 , 0 , 2010-01-28 21:25:06 , 550.0 , 950.0 , 1375.0 , 80.0 , 240 , 99 , 37 , 0 , 2010-01-28 21:25:07 , 550.0 , 950.0 , 1375.0 , 80.0 , 240 , 55 , 20 , 0 , 2010-01-28 21:25:08 , 550.0 , 950.0 , 1375.0 , 80.0 , 240 , 53 , 20 , 0 , 2010-01-28 21:25:09 , 550.0 , 950.0 , 1375.0 , 80.0 , 240 , 54 , 20 , 0 , 2010-01-28 21:25:10 , 550.0 , 950.0 , 1375.0 , 82.0 , 240 , 74 , 27 , 0 , 2010-01-28 21:25:11 , 550.0 , 950.0 , 1375.0 , 81.0 , 240 , 86 , 32 , 0 , 2010-01-28 21:25:12 , 550.0 , 950.0 , 1375.0 , 81.0 , 240 , 73 , 27 , 0 , 2010-01-28 21:25:13 , 550.0 , 950.0 , 1375.0 , 82.0 , 240 , 72 , 27 , 0 , 2010-01-28 21:25:14 , 550.0 , 950.0 , 1375.0 , 82.0 , 240 , 93 , 34 , 0 , 2010-01-28 21:25:15 , 550.0 , 950.0 , 1375.0 , 83.0 , 240 , 99 , 36 , 0 , 2010-01-28 21:25:16 , 550.0 , 950.0 , 1375.0 , 82.0 , 240 , 99 , 35 , 0 , 2010-01-28 21:25:17 , 550.0 , 950.0 , 1375.0 , 82.0 , 240 , 83 , 29 , 0 , 2010-01-28 21:25:18 , 550.0 , 950.0 , 1375.0 , 82.0 , 240 , 82 , 28 , 0 , 2010-01-28 21:25:19 , 550.0 , 950.0 , 1375.0 , 83.0 , 240 , 84 , 29 , 0 , 2010-01-28 21:25:20 , 550.0 , 950.0 , 1375.0 , 83.0 , 240 , 99 , 35 , 0 , 2010-01-28 21:25:21 , 550.0 , 950.0 , 1375.0 , 83.0 , 240 , 99 , 36 , 0 , 2010-01-28 21:25:22 , 550.0 , 950.0 , 1375.0 , 83.0 , 244 , 99 , 39 , 0 , 2010-01-28 21:25:23 , 550.0 , 950.0 , 1375.0 , 84.0 , 246 , 99 , 40 , 0 , 2010-01-28 21:25:24 , 550.0 , 950.0 , 1375.0 , 83.0 , 239 , 92 , 40 , 0 , 2010-01-28 21:25:25 , 550.0 , 950.0 , 1375.0 , 84.0 , 248 , 95 , 36 , 0 , 2010-01-28 21:25:26 , 550.0 , 950.0 , 1375.0 , 83.0 , 252 , 98 , 51 , 0 , 2010-01-28 21:25:27 , 550.0 , 950.0 , 1375.0 , 84.0 , 252 , 86 , 34 , 0 , 2010-01-28 21:25:28 , 550.0 , 950.0 , 1375.0 , 84.0 , 252 , 98 , 49 , 0 , 2010-01-28 21:25:29 , 550.0 , 950.0 , 1375.0 , 84.0 , 245 , 86 , 40 , 0 , 2010-01-28 21:25:30 , 550.0 , 950.0 , 1375.0 , 84.0 , 246 , 94 , 33 , 0 ,
@21:25:05 the cpu drops to 7x, the gpu-z log shows soon after that gpu usage (third column from the right) drop from 99 to 58.Code:01/28/10 21:25:00 16.98 24.2 100.0 100.0 27 01/28/10 21:25:00 17.02 25.7 100.0 100.0 28 01/28/10 21:25:00 15.79 27.5 100.0 100.0 27 01/28/10 21:25:00 16.71 24.7 100.0 100.0 27 01/28/10 21:25:00 17.01 24.9 100.0 100.0 27 01/28/10 21:25:00 16.72 25.0 100.0 100.0 28 01/28/10 21:25:00 15.47 31.6 100.0 100.0 27 01/28/10 21:25:00 16.97 25.0 100.0 100.0 27 01/28/10 21:25:01 16.95 24.3 100.0 100.0 27 01/28/10 21:25:01 16.92 25.2 100.0 100.0 28 01/28/10 21:25:01 16.10 25.7 100.0 100.0 27 01/28/10 21:25:01 16.72 25.7 100.0 100.0 26 01/28/10 21:25:01 16.98 25.2 100.0 100.0 26 01/28/10 21:25:01 17.01 25.0 100.0 100.0 27 01/28/10 21:25:01 16.87 23.9 100.0 100.0 27 01/28/10 21:25:01 16.77 24.3 100.0 100.0 27 01/28/10 21:25:02 17.06 24.9 100.0 100.0 26 01/28/10 21:25:02 16.58 25.0 100.0 100.0 28 01/28/10 21:25:02 16.18 25.3 100.0 100.0 27 01/28/10 21:25:02 17.05 26.2 100.0 100.0 27 01/28/10 21:25:02 17.09 24.9 100.0 100.0 26 01/28/10 21:25:02 16.71 24.6 100.0 100.0 26 01/28/10 21:25:02 16.88 25.2 100.0 100.0 27 01/28/10 21:25:02 16.77 24.2 100.0 100.0 27 01/28/10 21:25:03 16.95 24.1 100.0 100.0 27 01/28/10 21:25:03 16.67 26.3 100.0 100.0 28 01/28/10 21:25:03 16.78 28.9 100.0 100.0 26 01/28/10 21:25:03 16.29 25.7 100.0 100.0 27 01/28/10 21:25:03 17.04 24.7 100.0 100.0 27 01/28/10 21:25:03 17.07 24.9 100.0 100.0 26 01/28/10 21:25:03 16.61 24.7 100.0 100.0 26 01/28/10 21:25:03 16.95 25.2 100.0 100.0 27 01/28/10 21:25:04 16.95 24.4 100.0 100.0 27 01/28/10 21:25:04 16.78 25.5 100.0 100.0 27 01/28/10 21:25:04 15.94 25.8 100.0 100.0 27 01/28/10 21:25:04 16.99 26.4 100.0 100.0 27 01/28/10 21:25:04 16.86 25.0 100.0 100.0 27 01/28/10 21:25:04 16.88 24.1 100.0 100.0 27 01/28/10 21:25:04 17.00 24.8 100.0 100.0 26 01/28/10 21:25:04 16.98 25.2 100.0 100.0 27 01/28/10 21:25:05 16.57 24.6 100.0 100.0 27 01/28/10 21:25:05 16.61 24.7 100.0 100.0 28 01/28/10 21:25:05 16.20 29.1 100.0 100.0 27 01/28/10 21:25:05 16.96 24.8 100.0 100.0 27 01/28/10 21:25:05 16.63 23.8 100.0 100.0 27 01/28/10 21:25:05 16.68 23.4 100.0 100.0 28 01/28/10 21:25:05 14.62 24.4 100.0 100.0 30 01/28/10 21:25:05 7.00 22.1 100.0 100.0 32 01/28/10 21:25:06 7.00 22.2 100.0 100.0 32 01/28/10 21:25:06 7.00 21.8 100.0 100.0 33 01/28/10 21:25:06 7.00 28.2 100.0 100.0 33 01/28/10 21:25:06 7.00 19.9 100.0 100.0 33 01/28/10 21:25:06 7.00 22.1 100.0 100.0 33 01/28/10 21:25:06 7.00 22.1 100.0 100.0 33 01/28/10 21:25:06 7.00 22.8 100.0 100.0 33 01/28/10 21:25:06 7.00 22.3 100.0 100.0 33 01/28/10 21:25:07 7.00 22.1 100.0 100.0 34 01/28/10 21:25:07 7.00 22.8 100.0 100.0 33 01/28/10 21:25:07 7.00 28.4 100.0 100.0 34 01/28/10 21:25:07 7.00 20.0 100.0 100.0 34 01/28/10 21:25:07 7.00 22.2 100.0 100.0 34 01/28/10 21:25:07 7.00 21.1 100.0 100.0 34 01/28/10 21:25:07 7.00 22.1 100.0 100.0 34 01/28/10 21:25:07 7.00 21.6 100.0 100.0 34 01/28/10 21:25:08 7.00 21.8 100.0 100.0 34 01/28/10 21:25:08 7.00 24.3 100.0 100.0 34 01/28/10 21:25:08 7.00 32.3 100.0 100.0 34 01/28/10 21:25:08 7.00 19.0 100.0 100.0 34 01/28/10 21:25:08 7.00 20.9 100.0 100.0 34 01/28/10 21:25:08 7.00 22.2 100.0 100.0 34 01/28/10 21:25:08 7.00 21.3 100.0 100.0 34 01/28/10 21:25:08 7.00 21.5 100.0 100.0 34 01/28/10 21:25:09 7.00 22.6 100.0 100.0 34 01/28/10 21:25:09 7.00 22.5 100.0 100.0 35 01/28/10 21:25:09 7.00 27.0 100.0 100.0 35 01/28/10 21:25:09 14.24 19.6 100.0 100.0 29 01/28/10 21:25:09 17.18 24.7 100.0 100.0 29 01/28/10 21:25:09 16.82 23.2 100.0 100.0 29 01/28/10 21:25:09 17.06 23.4 100.0 100.0 28 01/28/10 21:25:09 16.68 23.4 100.0 100.0 28 01/28/10 21:25:10 17.05 24.0 100.0 100.0 28 01/28/10 21:25:10 16.71 24.2 100.0 100.0 29 01/28/10 21:25:10 10.37 28.6 100.0 100.0 32 01/28/10 21:25:10 7.00 20.6 100.0 100.0 33 01/28/10 21:25:10 7.00 22.5 100.0 100.0 34 01/28/10 21:25:10 7.00 25.1 100.0 100.0 34 01/28/10 21:25:10 7.00 22.9 100.0 100.0 34 01/28/10 21:25:10 7.00 22.8 100.0 100.0 34 01/28/10 21:25:11 7.00 22.2 100.0 100.0 34 01/28/10 21:25:11 7.00 23.6 100.0 100.0 35 01/28/10 21:25:11 7.00 29.5 100.0 100.0 35 01/28/10 21:25:11 7.00 20.5 100.0 100.0 34 01/28/10 21:25:11 7.00 21.5 100.0 100.0 34 01/28/10 21:25:11 7.00 22.9 100.0 100.0 34 01/28/10 21:25:11 7.00 21.5 100.0 100.0 34 01/28/10 21:25:11 7.00 21.8 100.0 100.0 35 01/28/10 21:25:12 7.00 21.6 100.0 100.0 34 01/28/10 21:25:12 7.00 23.9 100.0 100.0 35 01/28/10 21:25:12 7.00 30.4 100.0 100.0 35 01/28/10 21:25:12 7.00 20.4 100.0 100.0 35 01/28/10 21:25:12 7.00 22.8 100.0 100.0 35 01/28/10 21:25:12 7.00 22.4 100.0 100.0 35 01/28/10 21:25:12 7.00 22.0 100.0 100.0 35 01/28/10 21:25:12 7.00 23.0 100.0 100.0 35 01/28/10 21:25:13 7.00 22.4 100.0 100.0 35 01/28/10 21:25:13 15.06 25.5 100.0 100.0 31 01/28/10 21:25:13 16.08 27.0 100.0 100.0 30 01/28/10 21:25:13 16.72 21.9 100.0 100.0 29 01/28/10 21:25:13 17.08 22.0 100.0 100.0 29 01/28/10 21:25:13 17.08 22.1 100.0 100.0 30 01/28/10 21:25:13 16.91 21.4 100.0 100.0 29 01/28/10 21:25:13 16.95 22.4 100.0 100.0 30 01/28/10 21:25:14 17.52 22.2 100.0 100.0 29 01/28/10 21:25:14 16.90 24.4 100.0 100.0 30 01/28/10 21:25:14 16.32 26.7 100.0 100.0 29 01/28/10 21:25:14 17.05 24.4 100.0 100.0 29 01/28/10 21:25:14 16.95 24.2 100.0 100.0 29 01/28/10 21:25:14 17.09 23.8 100.0 100.0 29 01/28/10 21:25:14 16.89 23.2 100.0 100.0 29 01/28/10 21:25:14 16.85 22.9 100.0 100.0 29 01/28/10 21:25:15 16.98 23.5 100.0 100.0 29 01/28/10 21:25:15 16.82 24.4 100.0 100.0 30 01/28/10 21:25:15 16.13 27.1 100.0 100.0 29 01/28/10 21:25:15 16.70 23.1 100.0 100.0 29 01/28/10 21:25:15 16.88 23.2 100.0 100.0 29 01/28/10 21:25:15 16.42 22.8 100.0 100.0 30 01/28/10 21:25:15 11.20 26.3 100.0 100.0 32 01/28/10 21:25:15 7.00 23.9 100.0 100.0 33 01/28/10 21:25:16 7.00 21.8 100.0 100.0 33 01/28/10 21:25:16 7.00 24.2 100.0 100.0 34 01/28/10 21:25:16 7.00 30.8 100.0 100.0 34 01/28/10 21:25:16 7.00 21.7 100.0 100.0 34 01/28/10 21:25:16 7.00 22.4 100.0 100.0 34 01/28/10 21:25:16 7.00 22.5 100.0 100.0 34 01/28/10 21:25:16 7.00 22.8 100.0 100.0 34 01/28/10 21:25:16 7.00 22.0 100.0 100.0 34 01/28/10 21:25:17 7.00 21.9 100.0 100.0 35 01/28/10 21:25:17 7.00 24.8 100.0 100.0 35 01/28/10 21:25:17 7.00 31.2 100.0 100.0 35 01/28/10 21:25:17 7.00 22.8 100.0 100.0 35 01/28/10 21:25:17 7.00 22.8 100.0 100.0 35 01/28/10 21:25:17 7.00 23.1 100.0 100.0 35 01/28/10 21:25:17 7.00 23.2 100.0 100.0 35 01/28/10 21:25:17 7.00 23.0 100.0 100.0 35 01/28/10 21:25:18 7.00 22.6 100.0 100.0 35 01/28/10 21:25:18 7.00 24.8 100.0 100.0 36 01/28/10 21:25:18 7.00 31.7 100.0 100.0 35 01/28/10 21:25:18 7.00 21.8 100.0 100.0 35 01/28/10 21:25:18 7.00 21.9 100.0 100.0 35 01/28/10 21:25:18 7.00 22.6 100.0 100.0 35 01/28/10 21:25:18 15.02 24.5 100.0 100.0 31 01/28/10 21:25:18 16.60 24.0 100.0 100.0 31 01/28/10 21:25:19 16.80 23.7 100.0 100.0 30 01/28/10 21:25:19 17.03 22.6 100.0 100.0 33 01/28/10 21:25:19 16.10 26.8 100.0 100.0 30 01/28/10 21:25:19 16.93 24.1 100.0 100.0 30 01/28/10 21:25:19 17.10 24.0 100.0 100.0 30 01/28/10 21:25:19 16.79 23.9 100.0 100.0 29 01/28/10 21:25:19 16.68 23.8 100.0 100.0 30 01/28/10 21:25:19 16.84 24.4 100.0 100.0 30 01/28/10 21:25:20 17.01 24.2 100.0 100.0 29 01/28/10 21:25:20 17.11 24.5 100.0 100.0 30 01/28/10 21:25:20 16.61 27.0 100.0 100.0 29 01/28/10 21:25:20 17.14 23.1 100.0 100.0 30 01/28/10 21:25:20 16.98 23.9 100.0 100.0 30 01/28/10 21:25:20 16.90 25.7 100.0 100.0 30 01/28/10 21:25:20 16.90 25.2 100.0 100.0 29 01/28/10 21:25:20 16.83 22.8 100.0 100.0 30 01/28/10 21:25:21 16.92 22.6 100.0 100.0 29 01/28/10 21:25:21 16.45 24.6 100.0 100.0 30 01/28/10 21:25:21 16.41 24.0 100.0 100.0 29 01/28/10 21:25:21 18.18 20.3 100.0 100.0 28 01/28/10 21:25:21 18.66 20.4 100.0 100.0 28 01/28/10 21:25:21 18.52 20.8 100.0 100.0 28 01/28/10 21:25:21 18.46 20.9 100.0 100.0 29 01/28/10 21:25:21 18.40 21.2 100.0 100.0 28 01/28/10 21:25:22 18.58 20.8 100.0 100.0 28 01/28/10 21:25:22 17.21 28.4 100.0 100.0 30 01/28/10 21:25:22 15.47 27.6 100.0 100.0 30 01/28/10 21:25:22 15.49 38.1 100.0 100.0 29 01/28/10 21:25:22 17.05 23.1 100.0 100.0 29 01/28/10 21:25:22 17.36 18.6 100.0 100.0 29 01/28/10 21:25:22 15.66 37.9 100.0 100.0 29 01/28/10 21:25:22 18.30 18.2 100.0 100.0 29 01/28/10 21:25:23 19.05 17.7 100.0 100.0 28 01/28/10 21:25:23 18.53 20.0 100.0 100.0 29 01/28/10 21:25:23 18.36 22.7 100.0 100.0 28 01/28/10 21:25:23 17.53 24.3 100.0 100.0 29 01/28/10 21:25:23 16.05 31.1 100.0 100.0 28 01/28/10 21:25:23 16.90 20.0 100.0 100.0 28 01/28/10 21:25:23 17.33 18.0 100.0 100.0 28 01/28/10 21:25:23 17.78 18.1 100.0 100.0 28 01/28/10 21:25:24 17.07 17.2 100.0 100.0 28 01/28/10 21:25:24 17.45 18.9 100.0 100.0 29 01/28/10 21:25:24 16.08 31.8 100.0 100.0 29 01/28/10 21:25:24 16.39 24.6 100.0 100.0 31 01/28/10 21:25:24 16.25 24.9 100.0 100.0 30 01/28/10 21:25:24 16.98 19.8 100.0 100.0 30 01/28/10 21:25:24 16.79 19.3 100.0 100.0 31 01/28/10 21:25:24 15.48 19.2 100.0 100.0 31 01/28/10 21:25:25 16.34 19.2 100.0 100.0 29 01/28/10 21:25:25 18.90 19.4 100.0 100.0 30 01/28/10 21:25:25 14.86 23.5 100.0 100.0 32 01/28/10 21:25:25 7.00 24.2 100.0 100.0 35 01/28/10 21:25:25 7.00 25.8 100.0 100.0 35 01/28/10 21:25:25 7.00 28.0 100.0 100.0 35 01/28/10 21:25:25 7.00 24.4 100.0 100.0 35 01/28/10 21:25:25 7.00 22.1 100.0 100.0 35 01/28/10 21:25:26 7.00 22.8 100.0 100.0 35 01/28/10 21:25:26 7.00 23.6 100.0 100.0 35 01/28/10 21:25:26 7.00 29.6 100.0 100.0 35 01/28/10 21:25:26 7.00 20.9 100.0 100.0 35 01/28/10 21:25:26 7.00 22.3 100.0 100.0 36 01/28/10 21:25:26 7.00 22.6 100.0 100.0 35 01/28/10 21:25:26 7.00 22.7 100.0 100.0 35 01/28/10 21:25:26 7.00 24.2 100.0 100.0 36 01/28/10 21:25:27 7.00 23.3 100.0 100.0 36 01/28/10 21:25:27 7.00 27.0 100.0 100.0 36 01/28/10 21:25:27 7.00 30.4 100.0 100.0 36 01/28/10 21:25:27 7.00 24.9 100.0 100.0 36 01/28/10 21:25:27 7.00 24.9 100.0 100.0 36 01/28/10 21:25:27 7.00 23.7 100.0 100.0 36 01/28/10 21:25:27 7.00 22.5 100.0 100.0 37 01/28/10 21:25:27 7.00 23.9 100.0 100.0 37 01/28/10 21:25:28 7.00 22.6 100.0 100.0 37 01/28/10 21:25:28 7.00 30.9 100.0 100.0 36 01/28/10 21:25:28 7.00 32.4 100.0 100.0 36 01/28/10 21:25:28 7.00 19.8 100.0 100.0 37 01/28/10 21:25:28 7.00 20.9 100.0 100.0 36 01/28/10 21:25:28 7.00 21.6 100.0 100.0 37 01/28/10 21:25:28 7.00 21.4 100.0 100.0 37 01/28/10 21:25:28 7.00 21.6 100.0 100.0 37 01/28/10 21:25:29 14.49 19.8 100.0 100.0 32 01/28/10 21:25:29 18.27 20.4 100.0 100.0 31 01/28/10 21:25:29 16.55 22.5 100.0 100.0 31 01/28/10 21:25:29 17.46 18.0 100.0 100.0 30 01/28/10 21:25:29 18.55 19.0 100.0 100.0 30 01/28/10 21:25:29 15.23 38.1 100.0 100.0 31 01/28/10 21:25:29 18.52 17.6 100.0 100.0 30 01/28/10 21:25:29 18.14 18.6 100.0 100.0 30 01/28/10 21:25:30 17.23 19.8 100.0 100.0 31 01/28/10 21:25:30 18.53 19.7 100.0 100.0 30 01/28/10 21:25:30 14.35 39.3 100.0 100.0 31 01/28/10 21:25:30 15.17 24.1 100.0 100.0 34 01/28/10 21:25:30 7.00 27.5 100.0 100.0 35 01/28/10 21:25:30 7.00 29.1 100.0 100.0 36 01/28/10 21:25:30 7.00 26.8 100.0 100.0 36 01/28/10 21:25:30 7.00 22.7 100.0 100.0 36
@21:25:09 the cpu goes back up, gpu usage goes back up as well but since its averaged, not all the way to 99.
this is most likely BIOS set, but idk if asus will set it higher. -
Scratch that. I was talking about a different model.
-
yea, the vx doesn't have a 45W CPU
for anyone who follows this thread, i may have found a real-world application where this throttling affects performance and a solid reason for asus to issue a response that won't include "this only happens on synthetics, not in everyday use". Dolphin. i'll be making a summary of my testing shortly. -
using my semi-broken win7 and desktop side-by-side, below are 3 runs that i did on dolphin to exert regular usage that invokes throttling. i would've used throttlestop to log clocks, but it had reporting issues.
setup: asus clock (500/1250/800), 196.34, everything as up to date as possible
other setup: P5Q pro, e8400 @ 4.5GHz, HD4890 @ 975/1000, win7 x64 installed from the same disc and as closely config'd as possible.
dolphin r5009 x86 changes to default config: 1920x1080 fullscreen non-native, vsync, 16xAF, disable fog, overlay FPS, EFB to texture
testing: on super smash bros. brawl. 3-stock games on battlefield, i played ike and a lv9 cpu as marth. same matchup on the desktop, but cpu as ike instead. dolphin is set to affinity on cores 0 and 2. (if you plan on carrying out this test on xp, the mapping is 1 2 3 4 1 2 3 4 instead of 1 1 2 2 3 3 4 4 in affinity)
run 1
AA off
pretty much a solid 60 on both machines. no visible throttling on the G51J. some slowdowns at parts in the map, but those occured on both machines (most likely cache related).
note that both cores are almost always above 2GHz. GPU load is around 85-95%.
run 2
2xAA
the desktop held a solid 60 still. the laptop, not so much. observed FPS was consistently between 28 and 34. looking at tmonitor shows the effect of the throttling.
GPU usage drops to 60-70% with a peak of 80 and going as low as 50. much higher variance compared to the first run. the CPU throttling isn't the all-or-nothing we've seen before, it instead is only limited to the power allowed. this makes the variance go between 7x to 18x with the average around 1.7GHz on one core and 1.2GHz on the other.
run 3
4xAA
desktop holding strong at 60. not much change in the laptop from 2x. FPS now between 28 and 30.
GPU is still varying between 50 and 80%, at times dropping down to lower clocks. same pattern observed in CPU.
it's possible there's something with the way AA is handled on nvidia cards, but i hardly doubt that's the case as there would be a lot more chatter about it.Attached Files:
-
-
Can you be a little more specific? How can I fix something if I don't know what the problem is.
I'm going to be blunt. TMonitor is not accurate at all. It does not follow the method that Intel recommends in their November 2008 Turbo White Paper.
I hope the problem with ThrottleStop is that it is not the same as TMonitor. That would be a good thing. Maybe contact the author of TMonitor and ask him why he has chosen not to follow the Intel recommended method.
If you follow that method, you sure don't end up with the results that TMonitor displays. -
tmonitor might not be using the proper method, but in the end i use performance and temperatures as the final judgement. the logs are only there as formalities.
below is the log of what happens + screenshot. in general the multiplier is all over, load is <10% (whereas task manager says <2% at any given time). i am aware that it switches many hundreds of times a second, so it may not be an issue at all (seems to be at 7x a lot more on XP), but with the clocks jumping around like that it takes a bit more to point out throttling.
the only reason i said it was is because i'm not sure if 2 logical cores mapped to the same physical core can have different multipliers.
edit: added a short log from xp.
edit2: prime95 gets all cores up to 12.75 on win7. it could be something with my install, as i know it's not exactly "stable". i went through and disabled all services i thought unneeded (homegroup, wmp sharing, search, dns cache to name a few) and probably some experimental bluetooth driver stuff that (shouldn't) be there.
edit3: realtemp shows 933, 1000, and 1066 all apx. 1/3rd of the time (win7).Attached Files:
-
-
You have to keep in mind that ThrottleStop is displaying an average multiplier. Individual threads within a core can go to sleep independently so their average multipliers can and will be different. All cores in these CPUs run with the same multiplier but all cores and threads are not always in the active state the same amount of time.
That's what ThrottleStop is reporting.
Different operating systems have different background tasks and are going to give you different results. Even how you set them up in terms of Minimum processor state in Vista and Windows 7 is different than how XP works. ThrottleStop uses highly accurate internal timers and follows the Intel recommended method. You can trust what it's telling you.
I'll go have a look at your logs now. Just let me know anything you don't understand or anything that you would like to see done differently. I'm always open to making improvements for users.
Edit: The C0% data is not the same thing as the Task Manager load meter. It's measuring something completely different. What seems to happen at idle is that when the multiplier drops down to 7.0 and cores start going to sleep, the remaining core running at this reduced speed has to start working harder to process the background tasks. A CPU with a 7X multiplier is going to have to spend twice as much time executing code in the C0 state compared to a CPU with a 14X multiplier. The C0% load meter is accurate enough to show this. It will show you that the core that idled down is working harder and the C0% will increase. When clock modulation is being used it is also accurate enough to tell you that the CPU really is not working at 100% even though the task manager will show you 100% when the CPU is being throttled internally down to a crawl. In my opinion, the C0% is a much more meaningful number on these CPUs compared to the Task Manager load meter, especially when testing for throttling.
XP without antivirus installed is very lean and consistent and it should show you the C0% lower when you have the Control Panel -> Power Options set to Home/Office Desk compared to when this is set to Portable/Laptop if ThrottleStop is showing that the multiplier changes as it should. C1E also effects the multiplier at idle. If you are on Home/Office Desk and you enable C1E then the multiplier at idle is going to be jumping all over the place. That's what happens when you have different power options fighting over the CPU. One option tells the multiplier to go high while C1E tells it to go low so it jumps back and forth. Most software is not capable of telling you what's going on or ignores this and reports sky high multipliers like CPU-Z does at idle to cover this up.
Your log file shows me that Windows 7 doesn't settle down as much at idle. I think that's a good thing for Windows 7 and shows a problem with XP. I have found that you can have a significant load on a CPU in XP and it will stay stuck at the lowest possible multiplier. It doesn't come out of SpeedStep fast enough. It looks like Windows 7 is much better. In XP I have done one test where I can create a 25% load on the CPU and still have it stuck at the lowest possible multiplier. That's not a good thing. -
i assumed that if there are two threads running independently on two logical cores mapped to the same physical core, then one active would imply the other active as well. mistake on my part (wouldn't make sense).
i'll rerun the tests with throttlestop, hopefully to some visible effect. for a suggestion, having a multiplier column for each logical core in the log would be nice for times like these perhaps to the right of DTS. the green = off and red = on could also get confusing for people who rely on the tray.
+1 for the explanation (must spread some around first, but i won't forget). too much time on XP made me used to seeing it at min for most of the time
edit: and yea, setting it to Always On produces the same effect as on win7. -
I faced the double negatives since day 1 on this project. Does throttle stop on mean you are telling your computer to throttle or telling it to stop throttling? What about throttle stop? Does stop mean you are stopping the throttling or stopping the program.
It's a big confusing mess. Same with the colors. Red is the color of a stop sign so it originally made sense that the system tray would have the same color. When I added a second color to the system tray I didn't want to do a color swap or previous users would be confused. I should have put more thought into this originally but too late now.
The multiplier in the log file is the multiplier on the hardest working core. This gives a good indication of how hard your computer is working so if only a single thread is working hard then it will report the multiplier for that core or thread. You don't need to see all the threads in the log. For most users it would just become too much information. If you see a 7.0 in the log file then that means that no other core is higher than that so throttling is obvious.
I might add an option to report all of the multis in the log but it would be a user selectable option in the INI file or something like that so no one gets over run with numbers jumping all over the place in the log. -
as long as "throttlestop is enabled" -> stop throttling, i have no objections
from the pattern i saw during dolphin, it doesn't set the CPU all the way down but instead limits it slightly to 10-12x on two threads. sometimes it changes with one at 7 and one at 15, but reporting 15 makes it seem as though there's nothing unusual going on even though performance takes an even bigger hit.
if it takes more than an hour to implement don't worry too much, it's a unique case that would most likely ever be used by me. it took asus 3 months to fix the BSOD problem, and the new BIOS still isn't on the official site (hoping they change the limit or remove the throttle altogether...). -
It's OK if the multipliers are dropping down on cores or threads that have a low C0% since those threads are spending most of their time asleep. The average multiplier for them will be lower.
The multiplier reported in the log file is always the one from the hardest working core which better represents how hard the CPU is working. Post a screen shot or better yet a log file when you're doing the dolphin.
-
Can you elaborate or point somewhere where this is explained in detail. I want to know if a lot of what I think is going on isn't because tmonitor has led me up a garden path.
I thought it was just reporting what multiplier each core had at an instant in time, 20 times a second?
I found it and the i7turbo part of Realtemp both showed the same kind of results - and therefore assumed both were using similar, sounder logic (well compared to CPUz anyway) - with i7turbo showing the average multi, and Tmonitor giving an indication of what was going on re the up/down of turboboost.
btw I've not tried Throttlestop as I thought I read "it didn't work" and was for some Acer issue. -
Here is the Intel document that I followed.
http://download.intel.com/design/processor/applnots/320354.pdf
ThrottleStop works fine on a wide variety of CPUs including the i7-720QM in your laptop. The Asus laptops seem to have some performance throttling issues as well.
Before ThrottleStop I wrote i7 Turbo which also tracks the multipliers on each thread using the internal high performance timers and the method outlined in the Turbo White Paper.
http://www.fileden.com/files/2008/3/3/1794507/Turbo.zip
During quite a few situations I think you will find that the information that i7 Turbo or ThrottleStop displays can be quite different than TMonitor. I know my programs are based on the Intel documentation so I have no idea what TMonitor is based on. TMonitor and CPU-Z are written by the same folks so if you've ever noticed some problems with CPU-Z when monitoring these newer Core i CPUs then you need to give TMonitor a more critical look. -
Right, thx for the explanation.
So your opinion is purely based on the fact it doesnt use the average-over-time method from the whitepaper, or is because it actually "isn't accurate" - reports either wrong information (by waking cores to read the registers) or that how it reports is easily misinterpreted?
I did notice cpuz reported fud as far as CPU speeds. However Tmonitor does seem to pretty accurately reflect based on my understanding of turboboost what I expect to be the speed based on the loads placed on the cores. I'm pretty sure it just reports the register value (therefore multi & speed at an instant) 20 times a second.
Yes I was aware of the method the Intel White paper advises, but having seen what Tmonitor reports I think without any kind of stdev/percentile information it's pretty hard to see just how complex the CPU's self-management is off only an average. I'm still trying to get my head around how the one thread can be executed across the 8 cores due to a copy of each L2 being fully stored in L3 etc. and how this is somehow not crippling performance through cache thrashing. Beyond my nerd level.
Which is why I was looking at both i7turbo and tmonitor. Different information.
I do have a question for someone who has [forked out the huge sum for] a 820qm or 920xm, does this throttling thing happen, and does it throttle less/same/more? -
BTW Dolphin runs like a dog, I've only tried 1 game but am getting horrible slowdowns, with both CPU and GPU showing very low utilisation % readings. About time I looks for some optimisation guide methinks.
-
have to use EFB to texture, under the graphics plugin (gl and dx).
-
TMonitor uses the method outlined in the Turbo White Paper and is using the same timers that i7 Turbo uses so in theory the two programs should display the same results. When the CPU is lightly loaded, it is fudging the raw data and can report a multiplier much lower than what the data says the multiplier is at.
Here's an example on a Core i7:
![[IMG]](images/storyImages/tmonitorii.jpg)
RealTemp uses the same code as i7 Turbo and ThrottleStop. At idle, it reads these timers, sees that both timers for each thread are running at the same relative speed so this indicates the CPU is using its default multiplier which is 23.0 for an i7-950. TMonitor sees that the CPU is idle so it assumes that SpeedStep is enabled and the multiplier is at the minimum 12.0. That's not what the internal timers are saying according to the method that Intel recommends.
Here's an example with a Core 2 Duo Desktop CPU.
![[IMG]](images/storyImages/tmonitor1.png)
Based on the internal timers, ThrottleStop reports that the CPU is using its default maximum multiplier of 10.5. TMonitor shows that it is using the minimum 6.0 multiplier even though the Minimum processor state is set to 100%.
![[IMG]](images/storyImages/tmonitor2.png)
In the second picture, the Minimum processor state is adjusted to a very low number which lets the multiplier drop down at idle. ThrottleStop, using the internal timers, reports the 6.0 multiplier. TMonitor also reports 6.0 but it reports that regardless of the Minimum processor state setting.
![[IMG]](images/storyImages/tmonitor3.png)
In the last example I'm using my load tester to fully load the first core. The internal timers (ThrottleStop) are saying that both cores are at the maximum multiplier of 10.5. TMonitor shows one core using the maximum multiplier while the other core is using the minimum multiplier of 6.0. That's not what the timers are saying and to the best of my knowledge, that's a physical impossibility for a Core 2 Desktop CPU. The regular dropouts in the Core 1 TMonitor graph are also not accurate given that the first core has a constant 100% load on it.
I apologize for getting off topic but too many people are putting too much faith in TMonitor. It may be 100% correct but if it is then Intel's documentation must be 100% wrong. I'll believe Intel before I'll believe TMonitor. -
Thanks.
I've seen the momentary one-or-two-bar-wide "speed" dips and rises in Tmonitor, I guessed it was background processes waking up the other cores and lowering turboboost as a result, or just momentary brainfarts, so I guess I never assumed it to be 100% correct anyway (not when it records frequency as >5GHz fr example).
I understand you don't know what's going on inside Tmonitor, but from what you say it seems like it's not misleading me (and perhaps others) too much in what we think is going on due to the throttling stuff.
---
Interestingly, I noticed something regarding turboboost and the power4gear overclock profiles:
Doing a 1-thread Prime95 (locked to core 0), the average multipler was:
No turbo: ~19.1
Turbo: ~19.0
Extreme Turbo: ~19.3
...now I would have thought it would be *lower* if anything. I would quantify but I've just received a 2 week legal deadline to change our website so I may be a tad busy
-
When running a benchmark like Prime95 Small FFTs, there shouldn't be any "2 bar dips" that TMonitor constantly shows. That benchmark puts an incredibly consistent amount of load on a CPU core. There are no significant dips like TMonitor constantly shows. I was getting those dips at a constant frequency of about once every 5 seconds. That tells me something is not right. (It was exactly 4.6 seconds when tested with a stop watch.)
When I find a monitoring tool that has too many brain farts or shows me data that is not accurate then I can't depend on anything it is telling me. A lot of the time at full load it is probably very accurate but there are other situations when it is not. The data coming from ThrottleStop is very consistent and I know that it closely follows the method that Intel recommends.
The amount of turbo boost you get during any benchmark depends on how many active cores there are during the test and it is impossible to control that because there is no way to control all background processes. There is always going to be some random variation in the average multiplier during a single threaded benchmark like Super PI. I'm not sure how much variation should be considered normal. That would vary from one computer to the next depending on what background tasks they have running including what antivirus software they are using.
Statistically speaking, your results lead me to believe that all 3 power profiles are probably exactly the same and the difference is just normal variation due to background activity which causes turbo boost to constantly engage and disengage depending on the number of active cores.
No more testing. It sounds like it is time for you to use your computer and to get to work.
-
interesting, i haven't noticed the drops. not during prime95 at least.
temperatures and unexpected drop in performance are still the best way to check for throttling. both programs report 7x occurrences correctly, but hopefully the CPU will cooperate enough that i can use throttlestop for the partial-throttling in the emulators.
one more major assignment due at 10pm tomorrow and then it's game time (no reading in my "reading week")
i modified the throttle and BSOD wiki pages a fair bit, in case anyone follows them. what we need are ideas+screenshots on other programs/tests that would have this in normal usage. -
Oh don't worry, in the last month on top of all the normal stuff I've played through Borderlands twice, Clear sky (laziest lamest sequel ever...), gone about 1/4 through Far Cry 2, spent quite a few hours trying to port all the scripts/mods/packs across from the install of X3 Terran Conflict from the old lappy, watched all of Yes Minister & Yes Prime Minister, a bit of Scrubs, a lot of The Shield (fknel that was a good show) and the pretty lame 12th and 13th seasons of Southpark and thats just on this laptop
Sleep, what's that?
-
ok i have a 96 this weekend and when i was on duty i tested a few things out. I played CS sources at 1080p 16qx AA and 16x AS and got from 50-100fps with 70% gpu utilization. Why isnt using 100%? Also i played with 20 normal bots and it ran good. I threw in 30 bots and it drops to 20-30 fps. Also the gpu utilization went to 35-50%. I will do screen shots and videos of this tomorrow because i just got off duty and i am ing tired ^^. So yea this throttling is killing me. I shouldnt be running at 20-30fps becuase i added 10 extra bots. I assume this is because the bots require more cpu and the cpu pulls more juice from the gpu and it all comes to a "nice slow speed"
-
as soon as GPU usage takes a dip, you know it's the throttling. 10 bots is a little more strain, but not enough to set it back 50% in performance.
when you get in some videos/screenshots/logs, add a new section @ http://g51jbsod.wikia.com/wiki/CPU_throttling named CS:S bots. -
Will do just woke up but head is killing me :/ I do it tomorrow after homework. One thing is i never realized that throttling was this bad....I will also show screen shots of batman arkum asylum. I tried to see if prime 95 would cause it to throttle as well...but no cigar. I ran small and large FTTs or whatever on 1-4 threads and no throttling happened? Do you have any ideas of why that never affected gpu or game performance? Also what program can i use to record screen. I really dont feel like using my digital camera ^^
-
yea, one way to get to the limit is 2 cores @ 2.6GHz and 70% of asus 500/1250/800 clocks. any higher drain beyond that goes directly (and linearly) out of CPU. 75% -> 2.4GHz, 80% -> 1.8 iff the game doesn't require much, else drops to 933MHz. doubling CPU usage would probably halve the allowed GPU usage to 35% or so before the CPU gets hit. just about every game relies heavily on CPU or GPU, but never both. when the trend changes to being balanced, that's when we'll have a problem.
hopefully that makes a bit of sense. using only CPU (prime95, wprime) won't throttle. furmark on asus clocks might but only on some machines. my guess is different batches have different efficiency.
don't bother with videos, unless you want to prop up a camera. screenshots are more than enough, we already have proof the throttling affects regular usage. now we need to show several examples of real-world programs that induce it to have better standing in fighting with asus support. in the end, once we gather enough examples, all the unfortunate g51j and g51jx owners will be able to return it with obvious performance issues and absolutely no way for the repair center to fix it. only option is a replacement to something newer.
edit: added a description section for it in the wiki. hopefully it explains it better.
edit2: after thinking a bit about the results, the hardware is not the problem. it throttles, but it still goes over that limit with peripherals. no crash = hardware supplying more than 100W = no problem. maybe after beavering away at customer support they'll do something. -
yea but thalanix why didnt i loose frame rate or loose gpu utilization in batman arkum asylum when i tried to use prime95? It was like it had no effect on that game and that game requires a lot more resources. Also you didn't answer my question. Why doesnt my gpu get full utilized? I am getting low fps in batman and the gpu only goes up to 70%. Also the benchmark in batman only reaches 85% and at spots i hit 15-17 fps. When i used to have my old desktop that thing would be running cpu and gpu max when i was at either 30 fps or 120 fps depending on the game. I dont think in these situations its actually throttling because i am only using one. cpu or the gpu. I also noticed this when i did prime95 tests....cpu never is fully used either being a 1-8 thread task it doesnt matter. it never maxes multipliers. Any ideas?
EDIT also if you want to mess around on my laptop through vnc or whatever just say so and i can set that up.
EDIT Thanalix plz read wiki. I edit it and italized my edits. -
three reasons off the top:
- Vsync
- game optimization
- CPU limited throttling
your comment about low FPS makes it more probably that it's throttling.
why prime95 had no effect, it's possible it requires very little CPU usage (in which 933MHz would suffice).
if you could rerun those with a ThrottleStop + GPU-Z log ( http://g51jbsod.wikia.com/wiki/CPU_throttling#tools) i could make a better explanation.
no 3d over vnc, and there isn't much i'd be able to see anyway. -
isnt prime95 supposed to use lots of resources and cpu? i was using the torque tests. The frist 2 i tried using 1-4 threads and nothing effected it. Also i never use vsycn
EDIT i mentioned in wiki about potential current games that i theorize will have horrible throttling. Does anyone have those games to test or can send me to test? I especially want to try BF2 with bots. I can see that showing the worst throttling possible since it has good graphics and can have like 63 bots. -
prime95 should run all threads to their max. i was referring to batman.
either way, the only definite answer will come from parallel throttlestop/gpu-z logs. -
Has anyone done a throttling investigation with the new 208 bios?
-
still has the same threshold.
with the M60 and G51/G60 having the same BSOD problem, maybe we inherited the throttling AND BSOD from the M60 because asus was lazy? if they have a 90W adapter it would certainly make sense. -
*subscribed* Thanks for trying to fix this everyone!
-
I'm pretty sure I experienced throttling when playing Borderlands while zipping GBs of stuff with 7-Zip (normal compression) last night.
I didn't see anything abnormal in terms of fps dips (like most fps' there are stutters with huge explosions going off right next to you with heaps of smoke etc etc) and Rivatuner graph showed pretty consistent fps
It was only when I quit, I saw the Rivatuner log of "CPU Frequency" showing heaps of dips to 933. Now it may just be misreporting idle/low util% speeds so I'd very much like to doublecheck it later, but all other times playing games I've not seen speed dips like that in the logs, but then all other times I've not been doing 7zip in the background.
?
-
Could anyone check if Star Wars: The Force Unleashed gives slowdowns caused by throttling? I cannot check it now because my G51J is actually in the service center, but it was giving me massive slowdowns during gameplay for about 2-3 seconds, and then couple of seconds everything was OK, and again slowdown. It looked like it could be an effect of throttling. I was not aware of this problem then, so I haven't checked the cpu behaviour and the logs...
-
whenever it dips into 933 when doing anything is 99% (imo) of the time related to throttling. during a game or active use especially it should never drop below what turbo boost allows.
i don't have it to check, but that sounds like the cycling pattern (power up, throttle on; power down, throttle off etc.).
[Fixed/Workaround] Asus G51J(x) CPU throttling investigation
Discussion in 'ASUS Gaming Notebook Forum' started by thalanix, Jan 20, 2010.